Back

貿易緊張の中、ドルが弱まることで金が上昇しました

要点:

  • Gold (XAUUSD)は、米ドルの弱さと貿易への懸念の中、$2,900に向かって上昇しました。
  • トランプの関税拡大は経済の不確実性を煽り、中国は報復関税を課しました。
  • 連邦準備制度理事会(Fed)は慎重さを示していますが、今週の米国のインフレデータが市場のセンチメントを導くため、即時の利下げは予想されていません。

金は安全資産需要で上昇

XAUUSD(ゴールド)は、米ドルの弱さ安全資産の買い増しに後押しされ、火曜日に$2,900に向かって上昇しました。

テクニカル分析:再び強気の兆し

XAUUSDは0.25%上昇し、$2888.83でオープンし、$2896.00でクローズしました。貴金属は高いレベルを試し、$2900.47でピークに達し、セッションの安値$2880.31近くでサポートを見つけることで、適度な強気のセンチメントを示しました。

移動平均線(MA 5, 10, 30)は短期的な強気のクロスオーバーを示しており、上昇トレンドの出現を示唆しています。MACD(12,26,9)ヒストグラムはこの強気のセンチメントを確認しており、ゼロを上回っており、上向きのモメンタムが強化されていることを示しています。

即時のサポートは$2880.23付近にあり、より強いサポートは$2870近くに特定されています。これらのレベルを下回ると、新たな弱気圧力を示す可能性があります。一方、$2900.47での抵抗は重要な障壁です。これを超えると、価格が$2910~$2920に向かって進む可能性があります。

貿易緊張が高まり、連邦準備制度理事会が注目されています

トランプ大統領がカナダとメキシコの輸入に25%の関税を課し、さらに特定の中国製品に対する関税を20%に倍増させた後、センチメントはさらに悪化しました。特に、中国の米国の農産物に対する関税の引き上げが広範な経済の混乱の懸念を高めました。

市場参加者は、連邦準備制度理事会の次の動きに関する信号を求めて今後の米国のインフレ数字に注目しています。FRBのパウエル議長は、経済の不確実性が続いていることを強調しましたが、即時の利下げに対する急ぐ必要はないことを示唆し、市場参加者を慎重にさせています。

市場の展望

トレーダーは、米国の経済データと進行中の貿易状況を注意深く監視する必要があります。これらは短期的に金の価格方向に大きく影響します。$2,900.47以上の持続的なブレークはさらなる上昇モメンタムを促す可能性があり、再び米ドルが強くなると金の上昇を制限する可能性があります。

トレーディングを始めましょう – ここをクリックしてVT Markets口座を開設

需要懸念が高まる中、原油先物は苦戦していました。

要点:

  • WTI原油先物は1バレルあたり65.89ドルで取引を終え、最高値は66.05ドル、最安値は65.28ドルです。
  • 米国の関税や弱い中国の経済データへの懸念が原油価格を圧迫しました。
  • OPEC+は4月に生産を増加させる計画ですが、市場の不均衡が生じた場合は逆転する可能性があります。

WTI原油先物は火曜日に1バレルあたり65.89ドル近くで推移し、世界的な経済懸念や米国の貿易政策が市場の不確実性を引き起こしているため、損失を拡大させました。

トランプ米大統領がカナダやメキシコなどの主要な原油供給国に課した関税が後に延期され、加えて中国の報復措置が、原油需要に影響を与える可能性のある世界経済の減速に対する懸念を高めました。

さらに、新しいデータがデフレ圧力が強まっていることを示したことから、中国の経済健康に対する懸念が続いています。世界最大の原油輸入国である中国は、需要の期待が低下したため原油価格を押し下げました。

供給方面では、ロシアの副首相アレクサンダー・ノヴァクOPEC+は4月から原油生産を増加させる予定であると述べました。ただし、彼はこの決定は市場の状況が悪化した場合に逆転する可能性があると強調しました。

テクニカル分析

原油は65.893ドルで横ばいに取引されており、価格に大きな変動は見られません。取引セッション中には66.053ドルの高値65.283ドルの安値が記録され、最近の下落の後にレンジ内での動きが示されています。移動平均線(5, 10, 30)は継続的な統合を示唆していますが、MACDは早期の強気クロスオーバーの兆しを示しています。これは短期的な回復の可能性を示唆しています。

さらに上昇するためには67.671ドルでの抵抗が見られ、このレベルを突破すれば原油は68.20ドル-68.50ドルに向かう可能性があります。下方では、支持は65.283ドルにあり、これを下回るとさらに64.80ドル-64.50ドルに向かう可能性があります。トレーダーは、OPEC+の供給決定米国の在庫報告、およびグローバル需要のシグナル を監視すべきです。これらは原油価格の動向に影響を与えます。

技術的には、WTI原油は圧力の下にあります。抵抗は67.67ドルの近くにあり、支持は65.28ドルです。MACD指標は弱いモメンタムを示唆しており移動平均線はさらなる統合を示しています。

トレーディングを始めましょう – ここをクリックしてVT Markets口座を開設

テクノロジー株が日経を押し下げました

要点:

  • 日経225は36,164.15で取引を終え、0.47%下落し、セッションの最安値35,969.15に達しました。
  • テクノロジー株が下落を主導し、ウォールストリートの overnight下落を反映しました。

日経225が弱いグローバルセンチメントの中で下落を延長

日経225は火曜日に0.47%下落し、36,164.15で取引を終えました。テクノロジー主導の売りにより、トレーダーはリスク資産から手を引きました。指数は36,402.15の intraday 高値に達し、その後35,969.15の安値に滑り込みました。前セッションからの下落トレンドを延長しました。

市場センチメントは慎重であり、特に米国における世界の株式の弱さを反映しています。ここでは、インフレの懸念や貿易摩擦がボラティリティを引き起こしました。

テクノロジー株が下落を主導

テクノロジー株の売りが市場を下押しし、トレーダーがセクターへのエクスポージャーを減らす中、半導体および電子機器企業は圧力を受けています。米国のチップ株の下落を反映しました。通信および投資会社も損失を見ました。

一方、消費者および小売株も広範な市場の下落に続き、慎重なセンチメントを反映しています。対照的に、工業および防御セクターは一定の安定性を提供し、一部の製造業および消費財の株がわずかに上昇しました。

テクニカル分析

日経225は0.47%下落しており、継続的な売り圧力を反映しています。指数は36,335.65で始まり、36,164.15で取引を終えました。高値は36,402.15、安値は35,969.15でした。移動平均線(5, 10, 30)は下向きに傾斜しており、弱気トレンドを確認しています。

潜在的な回復には36,400近辺にレジスタンスが見られ、この水準を突破すれば36,700-37,000に向かう可能性があります。しかし、下落が続く場合は、35,969のサポートが重要です。これを下回ると、さらなる安値を目指す可能性があります。

指数が現在2024年9月以来の最低水準に近づいているため、トレーダーは今後の米国のインフレデータや中央銀行の決定に注目しています。これは未来の市場の指針となる可能性があります。

トレーディングを始めましょう – ここをクリックしてVT Markets口座を開設

米ドルが安値をつけた後、安定しました。

要点:

  • USDXは103.911で取引を終え103.404の intraday low から回復し、急落ではなく統合を示唆している。
  • 米国債のボラティリティと企業債スプレッドの拡大が、ドルの安定性にリスクをもたらしている。

USDXは市場のボラティリティの中で安定しています

米ドル指数(USDX)103.404のセッション安値から反発し、早期に三月上旬以来の最弱レベルに達した後、103.911で取引を終えました。より深刻な下落が予想されたにもかかわらず、この指数はサポートを見つけ、下落傾向の一時停止を示唆しています。

米国の貿易政策に関する不確実性が続く中でも、ドルは安定しており、急激な下落を拒んでいます。先日の報告ではUSDXが四ヶ月ぶりの低水準103.85に達したことが示されましたが、今日の価格動向は買い手がさらに損失を防ぐために介入したことを示しています

米国債はグローバルな金融担保として機能し、米国債市場のボラティリティの上昇は、流動性条件を厳しくする可能性があります。

さらに、過去三週間で企業債スプレッドが拡大していることは、市場ストレスの前触れとなることが多いです。歴史的には、そのような動きはビットコインを含むリスク資産の転換点に一致しています。

市場分析

USDXのチャート分析は、103.90を上回る水準を維持することが短期的な市場の安定性を示唆する可能性があることを示しています。これによりさらなる下落を避けることができるかもしれません。一方で、103.40を下回ると売り圧力が再び強まる可能性がある、特にインフレの懸念が再浮上する場合には。

市場全体のセンチメントは慎重であり、トレーダーは連邦準備制度の政策信号に対して警戒を怠っていません。これらの水準と外部の経済信号との相互関係は、今後のドルの軌道を決定する上で重要となります。

一部のアナリストは、USDXの下落がリスク資産に追い風になると見ているが、急な反発が株式や暗号通貨における上昇の勢いを乱す可能性もあります。今後数日が、ドルが下落トレンドを再開するのか、より確固たる地盤を見つけるのかを決定する上で重要となります。

トレーディングを始めましょう – ここをクリックしてVT Markets口座を開設

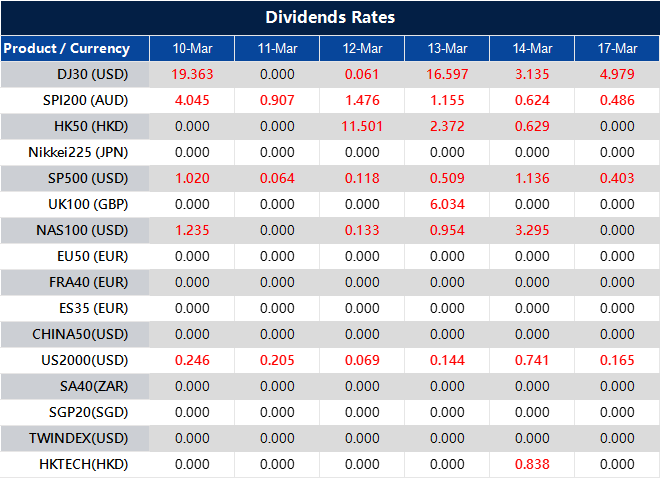
Dividend Adjustment Notice – Mar 10 ,2025

Dear Client,

Please note that the dividends of the following products will be adjusted accordingly. Index dividends will be executed separately through a balance statement directly to your trading account, and the comment will be in the following format “Div & Product Name & Net Volume ”.

Please refer to the table below for more details:

The above data is for reference only, please refer to the MT4/MT5 software for specific data.

If you’d like more information, please don’t hesitate to contact [email protected].

CL-OILは関税と供給懸念のため7週連続で下落でした

要点:

  • CL-OIL (WTI原油) は7週連続で下落し、2023年11月以来の長い連続下落となりました。
  • 金曜日にトランプ大統領がロシアへの制裁を脅かしたことを受けて、価格は一時68.20ドルに上昇しました。
  • サウジアラムコが3ヶ月ぶりにアジアの原油価格を引き下げ、供給に関する懸念が増しました。

CL-OILは経済と供給の懸念により下落

CL-OIL(WTI原油)は月曜日の早朝、1バレルあたり$66.53に下落し、米国が課した関税が世界的な燃料需要と経済成長を抑制する可能性に関する懸念が続いています。

テクニカル分析

WTI原油(CL-OIL)は0.79%下落し、$67.057で始まり、$66.395で終わりました。価格は変動があり、$68.120の高値に達し、$66.500の安値にまで下がり、弱気圧力が増加していることを示しました。

移動平均(5、10、30)は混合信号を示しており、短期平均が長期平均を下回って交差し、弱気の勢いを強調しています。MACD(12,26,9)ヒストグラムは負のままですが中立に向かってトレンドし、弱気圧力の低下を示唆しています。

即時サポートは$65.58で、レジスタンスは$68.20です。レジスタンスを超えた回復はさらなる上昇を引き起こす可能性がありますが、サポートを下回ると下落が拡大する可能性があります。

地政学的および供給要因がボラティリティを加える

価格は金曜日に短命な回復を見せ、米国のドナルド・トランプ大統領がウクライナとの平和を確保できなければロシアに対して制裁を強化すると脅した後、$68.20に達しました。しかし、トレーダーはロシアのエネルギーに対する制裁が緩和される可能性があるため、引き続き慎重です。

一方、OPEC+は4月からの計画された生産拡大を維持し、サウジアラムコはアジア市場向けに原油価格を引き下げ、十分な供給に対する懸念を強化し、市場のセンチメントをさらに悪化させました。

市場の見通し

トレーダーは、米国の貿易政策とロシアに関する地政学的緊張の進展に注意を払うべきであり、これらがCL-OILの価格動向の主要な要因となります。サポートは$65.50〜$66.00の範囲であり、上向きレジスタンスは金曜日の高値$68.20近くに位置する可能性が高いです。

トレーディングを始めましょう – ここをクリックしてVT Markets口座を開設

貿易の警戒感と強い円の中で日経225は上昇でした。

要点:

  • Nikkei 225が0.3%上昇し、37,116.15で取引を終了;Topixもわずかに上昇。
  • 上昇はウォールストリートを反映しているが、依然として米国の貿易政策不確実性の中で取引者は円高が市場の上昇余地を制限している。
  • 日本は1月に経常収支赤字を報告;実質賃金が前年同月比1.8%減少
  • テクノロジーセクターが上昇を牽引し、全体的な市場センチメントを後押しした。

日本株が回復、円高が懸念材料

日本のNikkei 225はわずかに上昇し、37,116.15で取引を終了した。これは金曜日のウォールストリートからのポジティブなシグナルを追ったものであり、トランプ大統領の下での米国の貿易政策の変動性の中で取引者は依然として慎重であった。

五ヶ月高の水準で推移する円高は、市場、とりわけ輸出に依存する株式には課題となっている。

テクニカル分析

Nikkei 225は0.09%下落し、37,116.15で取引を終了し、開幕時の37,148.00から値を下げた。インデックスは37,145.65まで上昇し、36,687.65まで下落し、わずかなベア圧力を示した。

移動平均(MA 5,10,30)は混合トレンドを示しており、最近の下落の後に価格が回復を試みている。MACD(12,26,9)ヒストグラムはプラスに転じつつあり、モメンタムの潜在的なシフトを示唆している。

重要な支持線は36,455.15であり、抵抗線は37,457.15として見られる。抵抗を上回る突破があれば上昇が拡大する可能性がある一方、37,000を維持できないと新たな売圧につながる可能性がある。

経済データは国内の圧力を示す

日本は1月に経常収支赤字を記録したが、これは二年ぶりのことであり、輸入が輸出を大幅に上回った。

一方で、インフレ調整後の実質賃金が前年同月比で1.8%減少し、二ヶ月のプラスの流れを逆転させ、国内消費の強さについて疑問を投げかけた。

それでも、テクノロジー株の堅調なパフォーマンスが市場を支え、ディスコ(+2.2%)、レーザーテック(+2.6%)、アドバンテスト(+0.9%)が含まれる。

市場の見通し

トレーダーは通貨の動きや米国の貿易の発展を注意深く監視する必要がある。円高が続けば、日本株のさらなる上昇を抑制する可能性がある一方、貿易政策の明確化が市場の信頼を再活性化させるかもしれない。

トレーディングを始めましょう – ここをクリックしてVT Markets口座を開設

As risk aversion rises, USDJPY retreats below a crucial swing zone towards 61.8% retracement level

The USDJPY is declining as risk aversion grows, with stock markets facing pressure and bond yields decreasing. The 10-year yield has fallen by 5 basis points, while the 2-year yield decreased by 5.7 basis points.

Equity markets are also weakening, with the NASDAQ down by 1.63% and the S&P 500 declining by 1.23%. On the technical side, USDJPY has dropped below a significant swing area between 147.21 and 147.34, with the next key support identified at the 61.8% retracement level from September’s rally, positioned at 146.94. A sustained movement below this level may suggest a more negative technical outlook.

The decline in USDJPY reflects a growing sense of caution in financial markets. Investors typically move towards safer assets when uncertainty rises, and we see that happening now. Stock markets are under pressure, and at the same time, bond yields are falling. Lower yields indicate stronger demand for bonds, which often corresponds with a risk-off approach from investors. The 10-year yield is down by 5 basis points, while the more short-term focused 2-year yield has fallen slightly more, showing a 5.7 basis point decrease.

Equities are feeling the strain as well. The NASDAQ, which leans towards technology stocks, has dropped by 1.63%, while the S&P 500 is lower by 1.23%. Selling pressure continues to be apparent, and if this persists, it could reinforce the broader aversion to risk.

From a technical perspective, USDJPY has now moved below an area that previously acted as support between 147.21 and 147.34. This signals growing weakness, as failure to hold above these levels suggests sellers are gaining control. The next line to watch is the 61.8% retracement from September’s rally, located at 146.94. Given how widely followed this retracement level is among market participants, a breach below it could trigger further downside movement.

If downward momentum strengthens, we may see additional technical selling from traders who rely on these key levels for their strategies. This kind of positioning can create sharper movements, particularly if broader risk sentiment remains weak. On the other hand, if buyers step in around current levels, there may be an effort to stabilise price action. However, that would largely depend on whether broader market conditions allow for it.

For now, the tone in financial markets remains cautious. The reaction in stocks and bonds underscores this, and the technical break in USDJPY aligns with that sentiment. If this trend continues, it would not be surprising to see more defensive positioning across asset classes.

Stocks are experiencing a decline, with NASDAQ dropping 1.09% and S&P 500 close behind

Stocks are experiencing a downturn, with the NASDAQ declining by 196.47 points (1.09%) to a level of 17,872. The S&P 500 has decreased by 53.5 points (0.94%), now at 5,685.

The S&P 500 is moving further away from its 200-day moving average of 5,732.70. The NASDAQ is set to close below its 50-week moving average for the first time since March 2023.

This decline marks the NASDAQ’s third consecutive weekly decrease, down 5.15% this week. The S&P 500 has also recorded three weeks of consecutive losses, currently down 4.61%.

Market Momentum Shift

These declines highlight a change in momentum. Markets do not move in straight lines, but patterns emerge when volatility increases, and recent weeks have demonstrated that. The NASDAQ breaking below its 50-week moving average signifies more than a temporary pullback. Since March 2023, buyers have defended this level, suggesting that sentiment has shifted. A breach of this kind often encourages further selling, as traders who previously relied on this as an entry point begin to exit.

The S&P 500 distancing itself from its 200-day moving average reinforces the lack of buying strength. This isn’t a minor fluctuation—it extends a pattern of sellers pressuring prices lower. When major indices repeatedly fail to hold key technical thresholds, the argument for a short-term recovery weakens.

Weekly trends matter. A single red week can be dismissed as normal market action, but three in a row suggest larger forces at play. The NASDAQ’s 5.15% drop this week is not an isolated occurrence. The S&P 500’s 4.61% loss mirrors that weakness, further emphasizing that downward pressure is widespread.

We must also pay attention to volume. A decline supported by higher-than-normal trading activity signals conviction behind the move. If institutions are reducing exposure, rallies may struggle. If volume is lacking, the selling could be less durable. Understanding this distinction helps avoid reacting too soon.

Sentiment alone does not dictate market direction. Interest rates, economic data, and corporate earnings cannot be ignored. Market participants anticipating a rebound must ask what has changed. Buying after notable declines is common, but without a shift in the factors driving the sell-off, such attempts can be premature.

Key Support Levels

Watching how indices behave around support levels can provide clarity. A recovery that lacks momentum may only serve as a temporary pause before further declines. Conversely, a sharp move upward with strong participation could indicate renewed confidence.

There is no single factor determining where prices will settle, but patterns, volume, and external catalysts all shape expectations. The next few weeks will determine whether this is a passing dip or something deeper.

Create your live VT Markets account and start trading now.
Centeno mentioned the inflation cycle nearing resolution, with ongoing ECB rate cuts until targets are met

ECB’s Centeno stated that the economy is nearing the end of the current inflationary cycle. He confirmed that rate cuts will persist until inflation reaches the designated target.

The ECB’s latest projections indicate headline inflation at 2.3% for 2025, 1.9% for 2026, and 2.0% for 2027. The increase for 2025 is attributed to stronger energy price movements.

Inflation Forecast Breakdown

Excluding energy and food, inflation forecasts are 2.2% for 2025, 2.0% for 2026, and 1.9% for 2027. The current average remains above the CPI target of 2.0%, so convergence has not yet been achieved.

Centeno’s remarks suggest the European Central Bank will continue lowering rates for the foreseeable future. Policy adjustments will aim to bring inflation in line with the target, though this process may take several years. Recent predictions reflect this, with inflation not expected to hit 2% consistently until 2026.

Fresh estimates for next year show inflation slightly above this level, primarily due to movements in energy markets. This means external cost pressures are still playing a role, which could introduce some volatility. However, when excluding energy and food, projections are lower, meaning underlying trends may be moving in the desired direction. That being said, numbers remain marginally off target, reinforcing why rate reductions are set to continue.

Policy Adjustments And Market Reactions

For traders analysing price movements, expectations around policy shifts remain clear. If projections hold, rate adjustments will follow a path aimed at achieving price stability. While current levels suggest inflation is moderating, the ECB has made it clear that policy will stay accommodative until full convergence occurs.

Understanding these shifts allows for better positioning in the weeks ahead. Inflation expectations set by the ECB establish a framework for possible rate decisions, influencing how markets react. By paying close attention to how actual inflation progresses relative to forecasts, any deviations in pricing trends can present new opportunities.

Policymakers have not indicated any abrupt changes, so adjustments will likely be gradual. The pace depends on how quickly inflation aligns with targets. Given that energy prices remain unpredictable, this element must be factored into short-term expectations. While broader trends suggest a downward trajectory, external factors mean vigilance is still required.

Create your live VT Markets account and start trading now.

Back To Top
server

こんにちは 👋

どうお手伝いできますか?

すぐに私たちのチームとチャット

ライブチャット

次の方法でライブチャットを開始...

  • テレグラム
    hold 保留中
  • 近日公開...

こんにちは 👋

どうお手伝いできますか?

テレグラム

スマートフォンでQRコードをスキャンしてチャットを開始するか、 ここをクリックしてください.

Telegramアプリやデスクトップ版がインストールされていませんか? Web Telegram をご利用ください.

QR code