トレーディングを始めましょう – ここをクリックしてVT Markets口座を開設
現在、銀はオンスあたり約52.40ドルであり、最近のピークである53.77ドルから後退していますでした。
銀の価格は、ロンドンにおける流動性不足や米中貿易緊張の再燃に対する懸念から急騰しました。灰色の金属は、すでに53.77ドルに達した後、トロイオンスあたり52.40ドル近くで取引されています。これは、安全資産需要の急騰によるものです。
ロンドンのトレーダーは、流動性不足のために銀バーの空輸を選択しており、需要の急増を反映しています。インドでは、銀が祝祭需要によって世界の相場よりも最大10%高いプレミアムで取引されており、上場投資信託や宝飾品業者に影響を与えています。
米中間の貿易緊張により新しい港湾手数料や特別税が課され、不確実性が高まっています。これらの緊張の中で銀の安全資産としての地位は魅力的になりますが、中国は対話を通じてこれらの問題を解決する意向を示しています。
銀は歴史的に価値の保存手段として評価されています。価格の動きは地政学的安定性、金利、及び米ドルの強さによって影響を受け、銀はドル建て資産として影響を受けます。
電子機器や太陽エネルギー部門からの工業需要も銀の価格に影響を与えており、米国、中国、インドでの重要な使用が見られます。銀の価格は安全資産としての地位から金に従う傾向があり、金/銀比率は評価指標として使用されています。
要点:
– 銀は52.40ドル近くで安定しており、53ドルを超えた後の重要な決定ポイント。
– 銀オプションの暗示的ボラティリティが急上昇し、投機目的でのロングコールの購入が非常に高価に。
– 銀バーのロンドンへの高コスト輸送とインドでの10%プレミアムが物理的市場のひっ迫を示す。
– フューチャーズ曲線でのバックワーデーションの深まりを注視することが重要。
– 米国のインフレ率が予想を上回り、ハード資産保持の妥当性が強まる。
– 銀の需給ストーリーが数年間の蓄積を経ており、これがラリーの堅固な基盤を提供。
– 銀インスティチュートの報告: 2024年には特に光伏部門からの記録的な工業需要。
– 金/銀比率は57:1付近、2023年及び2024年の85:1からの急落。
アナリストは、イギリスの雇用統計がややハト派的で、賃金成長が予測を下回っていると指摘しました。
イングランド銀行の利下げの見通し
イギリスの最新の雇用報告は穏やかなものであり、民間部門の賃金成長は前年同期比で4.4%に低下し、予想を少し下回りました。INGのFXアナリスト、フランチェスコ・ペソレ氏は、過去三ヶ月間、年率が2.4%で安定しており、12月までに3.7%に低下するという予測がイングランド銀行の予測と整合していると指摘しています。 公共部門の給与は現在の財政政策により高成長を示しましたが、これは来年持続することは期待されていません。失業率はわずかに上昇していますが、ONSによればデータの質は改善しています。雇用市場は冷却の傾向を示しており、賃金成長の moderationが続いています。 11月のイングランド銀行の利下げの見通しは減少していますが、12月の利下げは秋の予算後にはより現実的なものとなるでしょう。2月の利下げは、もう一度のインフレと雇用データの発表を経て期待されています。市場の反応は、12月の利下げの価格設定が7ベーシスポイントから9ベーシスポイントに上昇し、2年物GBPスワップレートが4ベーシスポイント下落したことも含まれています。EUR/GBP為替レートは0.870を超えて上昇し、将来的な上昇はフランスの政治情勢に影響を受ける可能性があります。 今朝の雇用報告は、イギリスの労働市場がついに冷却していることを示唆しています。民間部門の賃金成長は、イングランド銀行にとって重要な指標であり、予想よりも低下しました。この傾向は、わずかな失業率の上昇と相まって、経済のインフレ圧力が緩和されることを指し示しています。 他の最近のデータでもこれが確認されており、2025年9月の最新のCPIインフレ率は2.1%で、イングランド銀行の目標をわずかに上回っています。さらに、Q3のGDPの初期見積もりは、経済が0.1%の成長で停滞したことを示しました。これらの数字は、イングランド銀行が現在の4.0%の基準金利からの政策緩和を考慮するための説得力のある根拠を構築しています。市場の反応と戦略
これにより、低金利へのポジショニングが魅力的な戦略となります。市場が12月の利下げの確率を小さく見積もっている中、2026年3月のSONIA先物を購入することは、この見方を表現する方法となり得ます。今朝のデータを受けて、2年物スワップレートが下落したことから、この傾向はまだ続く可能性があります。 よりハト派的なイングランド銀行はポンドに重くのしかかるでしょう。ニュースを受けてEUR/GBPはすぐに0.870を超えて急騰しました。トレーダーは、ドルまたはユーロに対してさらにポンドが弱くなることに対するリスクヘッジや利益確保のためにGBPプットオプションの購入を検討するかもしれません。 しかし、秋の予算を前に公共セクターの給与の高騰が懸念材料であるため、注意を払う必要があります。イングランド銀行は2023年の頑固なインフレを思い出し、早すぎる利下げを警戒するでしょう。予算における財政的な手当の兆候があれば、最初の利下げは2026年まで遅れる可能性があります。 株式市場にとって、低い借入コストの見通しはポジティブです。この環境は今後数週間のイギリス株価指数を支える可能性があります。FTSE 100に対するコールオプションを使用することは、経済の冷却が急激な景気後退に転じた場合でもリスクを定義しつつ上昇へのエクスポージャーを得る方法となります。トレーディングを始めましょう – ここをクリックしてVT Markets口座を開設
ニュージーランドドル、USDに対して6日連続で下落し、5ヶ月ぶりの安値に達しました。
ニュージーランドドルに対する貿易戦争の影響
ニュージーランドドルは0.5700を下回り、5ヶ月ぶりの安値となる0.5684に達しました。この下落は、米中間の緊張の高まりによって影響を受けており、NZDにも影響を及ぼしています。この下落は、先週のRBNZ(ニュージーランド準備銀行)のOCR金利を50ベーシスポイント引き下げた決定に続いています。 米中の貿易緊張は、NZD/USDに影響を及ぼし続けており、6日連続で下落しています。この緊張は、両国間の貨物船に対する新料金の導入によって悪化しており、貿易戦争のエスカレーションへの懸念を引き起こしています。 中国の商務省は対話を通じて問題を解決することへの期待を表明し、米国に行動を修正するよう促しています。これは、全球的なサプライチェーンの安定性に対する懸念の中で起こっています。 これらの貿易に関する懸念は、最近の金利引き下げによって既に弱体化しているニュージーランドドルにプレッシャーを追加しています。米国と中国の間の経済的対立は貿易戦争として知られ、グローバルコストに影響を与える重要な貿易障壁や関税を含んでいます。 ドナルド・トランプが米国の大統領に復帰した際に緊張が再燃し、彼は中国に対して60%の関税を課しました。これにより貿易の対立が再燃し、グローバルなサプライチェーンに影響を及ぼし、消費者物価指数のインフレーションが増加しています。 ニュージーランドドルが0.5700の水準を下回ったことで、明確な下降トレンドが固まっていることが見られます。この弱さは、米中貿易に関する新たな懸念と先週のRBNZによる攻撃的な50ベーシスポイントの金利引き下げの組み合わせによって引き起こされています。5ヶ月ぶりの安値への移行は、キウイに対する下向きの勢いがしっかりしていることを示唆しています。米国連邦準備制度およびRBNZの政策の影響
この状況は、2018-2019年の貿易戦争を思い起こさせるものであり、この期間にNZD/USDは地政学的緊張の高まりによって15%以上下落しました。新たな関税が2025年1月から施行されているため、今後数週間でボラティリティが増加することが予想されます。デリバティブトレーダーは、新たなヘッドラインが出るたびに急激で突然の動きの高い確率を見越して価格設定を行うべきです。 RBNZの予期しない金利引き下げは、米国連邦準備制度との間で重要な政策の乖離を生み出し、米連邦準備制度はインフレーションを抑えるために金利を安定させていますが、最後の四半期のインフレーションは3.2%のままでした。この金利差の拡大は、米ドルを保持することを魅力的にし、NZDに重くのしかかります。市場は、2026年初めまでにRBNZから少なくとももう一回の金利引き下げを織り込んでいます。 トレーダーにとって、この環境はNZD/USDの下落とインプライド・ボラティリティの上昇から利益を得る戦略を有利にします。キウイに対するプットオプションの購入は、リスクを設定しつつさらなる下落を予測するための直接的な方法を提供します。また、逆転があり得ないと考えるトレーダーからプレミアムを集めるために、アウト・オブ・ザ・マネーのコールスプレッドを売る機会も見受けられます。 NZDが中国経済の代理と見なされる理由を忘れないようにする必要があります。ニュージーランドの総輸出のほぼ30%が中国向けであり、特に乳製品や林産物です。2025年9月の最近のデータでは、中国の港湾活動が新しい輸送料金の直接的な影響で月次で5%の減少を示しました。この貿易フローにさらなる混乱が加われば、キウイドルは即座にさらなる弱体化につながります。 今後を見据えて、我々は中国の製造PMIデータや北京からの報復的発表に注目する必要があります。弱いPMIの数字は米国の関税の負の影響を確認し、NZD/USDのさらなる下落を引き起こす可能性が高いです。トレーダーは機敏さを保つべきであり、ワシントンまたは北京からの政策発表が迅速に状況を変える可能性があります。トレーディングを始めましょう – ここをクリックしてVT Markets口座を開設
INGの専門家によれば、OPECは2026年に石油供給不足が減少することを予測しており、価格に影響を与えるとのことでした。
OPECは市場のバランスを期待しています
現在、油価格は安定しており、市場はトランプ-プーチン会議を待っています。OPECは、来年の供給不足に対応するために生産を増加させる計画を立てていると、INGの専門家が述べました。 OPECは月次の石油市場報告書の中で、今年の世界の石油需要成長予測を1日あたり130万バレル(b/d)、2026年までには140万b/dに維持しました。また、供給予測も維持しており、非OPEC+生産者が今年は81万b/d、2026年には63万b/dの生産増加を見込んでいます。 OPECは、来年に世界の石油市場が需要に応じて供給が増加することでバランスを取ると予想しています。9月には、OPECは供給を54万b/d増加させ、合計2840万b/dに達しました。この増加にはサウジアラビア、UAE、イラク、イラン、ベネズエラからの大きな貢献がありました。 国際エネルギー機関(IEA)は、さらなる洞察を加える石油市場報告書を発表する予定です。油価格戦略の管理
この予測は単なる憶測ではなく、現在の行動によって裏付けられています。2025年9月、OPECはすでに生産を54万バレル/日増加させ、サウジアラビアやUAEのような主要生産者が供給を増やしています。この増加した供給が現在市場に影響を与えており、価格に対する実際の要因となっています。 供給側のニュースに対して、需要面では慎重な見方がされています。最新のEIA報告書では、アメリカの原油在庫が180万バレル予想外に増加し、2024年の大部分で見られた一貫した減少と対照的でした。さらに、中国の最近の製造業PMIデータは予測を下回り、新年に向けた石油需要の強さについて懸念を引き起こしています。 今後数週間のデリバティブ戦略には、この環境が急激な強気の賭けに対して慎重を求めることになります。2026年の長期コールオプションへのエクスポージャーを減らし、既存のロングポジションに対してカバードコールを売る戦略を検討するべきです。よりバランスの取れた市場が見込まれることを考慮すると、価格が横ばいまたは下落するシナリオで利益を上げるためにベアコールスプレッドを確立することも効果的な方法となるでしょう。トレーディングを始めましょう – ここをクリックしてVT Markets口座を開設
関税緩和発表後、USDは損失を回復し、EUR-USDは1.18に苦しんでいました
USDの安定要因
EUR/USDの低下にはいくつかの理由がありますが、リスクは均等に分布しているわけではありません。連邦準備制度の独立性、関税問題、及び米国のシャットダウンが問題とならない可能性は、USDの安定化につながる可能性があります。 しかし、米国の貿易政策が年間を通して影響を及ぼし続け、つまり連邦準備制度が利下げに傾く場合、EUR/USD は大きな影響を受ける可能性があります。あまり可能性は高くありませんが、このシナリオはEUR/USDの水準に重大な影響を与えることがあります。 連邦準備制度の委員による金融政策に関するコメントの後、米ドルはユーロに対して再び足場を取り戻しました。先週1.08のレベルに近づいた後、EUR/USDペアは現在1.07を下回っています。現時点では、抵抗が最も少ない道は強い米ドルの方向に向かっているようです。 一見すると、これは来年後半の米ドルの弱体化に対する私たちの見解と矛盾しているように見えますが、短期的には低い水準が常に可能であったことは事実です。米国経済は2025年第3四半期に年率1.5%の成長率に減速したにもかかわらず、依然として欧州を上回っています。最新の製造業PMIデータは、欧州では47.8の収縮を示しています。米国のインフレが3%を超えて安定している限り、市場は連邦準備制度が金利を下げる理由はほとんどないとみなすでしょう。トレーダーの考慮事項
低いEUR/USDに対する多くの根拠がありますが、リスクは均等にバランスされているわけではないことを忘れてはいけません。予想以上の米国経済の急激な減速は最も可能性の高いシナリオではないかもしれませんが、その影響は重大です。トレーダーは、プレミアムを得ながら継続的なドルの安定を見越して、実行価格外のEUR/USDコールオプションを売ることを検討するかもしれません。 ただし、今後の米国の雇用データや小売売上高データが失望を招く場合、物語は急速に攻撃的な連邦準備制度の利下げへとシフトする可能性があります。我々は2023年初めの銀行ストレスの際、政策の転換を市場が突然予想したため、ドルがいかに急速に弱体化したかを目の当たりにしました。このリスクが沈黙しているからといって、消えてしまったわけではありません。 したがって、デリバティブトレーダーはこの不確実性を考慮した戦略を使用する必要があります。短期的なポジショニングはドルを支持するかもしれませんが、EUR/USDストラドルのような戦略を通じてボラティリティを購入することは賢明かもしれません。これにより、トレーダーは大きな価格変動から利益を得ることができ、現在の経済見通しからの急な変化に対してヘッジすることができます。トレーディングを始めましょう – ここをクリックしてVT Markets口座を開設
インドのインフレが緩和され、ルピーが約88.90に下落する中、米ドルが上昇しました。
インド・ルピーは米ドルに対して弱含み、88.90前後で取引されていました。これは、トランプ大統領と習近平が10月下旬に会談予定であるため、米中間の貿易緊張が和らいできたことによるものです。
米ドル指数の更新
米ドル指数は、6つの主要通貨に対するグリーンバックを測定し、99.25近くで強固な状態を保持していました。中国は米国との話し合いを確認したものの、ワシントンの政策が差別的であると主張しています。 インドの小売インフレ率は9月に1.54%に鈍化し、予想を下回り、2017年6月以来最も低い水準になりました。インド準備銀行(RBI)は、インフレ率が目標の2%-6%バンドを下回っているため、レポ金利をさらに引き下げる可能性があります。 今年、RBIはレポ金利を100ベーシスポイント引き下げて5.5%にしました。一方で、ロシアからのインドの石油購入に関する議論がルピーに影響を与えています。 外国の投資家はインド株に再び関心を示し、10月7日から10日の間に32,893.0クロールの純買いがありました。テクニカル面では、ルピーはドルに対して過去最低値近くにあり、混合した指標が価格動向の可能性を示唆しています。ルピーの弱さにおける機会
インド・ルピーの現在の弱さは明確な機会を提供しています。インドの小売インフレが1.54%に冷却しているため、RBIが12月に再度利下げを行う強い理由が見られます。この金融政策の乖離は、ハト派的なFRBとは対照的に、USD/INR為替レートが高くなることを根本的に支持しています。 デリバティブトレーダーは、さらなるルピーの弱さにポジショニングを考慮すべきと考えています。USD/INRペアが89.12の過去最高値近くで推移しているため、90.00前後のストライク価格で11月または12月の満期のアウト・オブ・ザ・マネーのコールオプションを購入することは賢明な戦略かもしれません。このアプローチはダウンサイドリスクを制限し、ペアが現在の抵抗を突破した場合には大きな上昇の可能性を提供します。 歴史的なパターンを見ると、2019年にインフレーションが低い状況下でのRBIの連続的な利下げがルピーの持続的な下落につながったのを確認しました。現在のデータはこの見解を強化しており、外国機関投資家は短期間の買いの波にもかかわらず、全体としては純売りを続け、前四半期には15000クロール以上の資金をインド市場から引き上げました。この基盤的な資本流出は、ルピーにさらなる圧力を与えます。 米中首脳会談が10月下旬に予定されていることは注目すべき主要なイベントです。好材料があれば新興市場通貨に対する圧力を一時的に和らげる可能性がありますが、失望や再度の緊張が生じれば、米ドルが強化され、USD/INRペアはさらに上昇する可能性があります。最近の1か月のインプライド・ボラティリティの上昇は6.2%で、マーケットは今後数週間での大きな動きを既に織り込んでいることを示唆しています。 リスク管理のためには、88.71前後の20日指数移動平均を注意深く観察する必要があります。このレベルを決定的に下回ると、強気の勢いが衰えている可能性があり、ロングポジションの潜在的な終了ポイントを示すかもしれません。しかし、ペアがこの支持線を上回る限り、抵抗の少ない道は90.00の水準に向かうように見えます。トレーディングを始めましょう – ここをクリックしてVT Markets口座を開設
フランチェスコ・ペソレは、フランスの政治に明確な状況が見えるまでユーロの回復を疑問視していました。
ユーロは、米国からのマクロ経済の変化や関税などのネガティブなニュースがない限り反発することは考えにくいです。フランスの政治的不確実性も、ユーロの回復の可能性に影響を与えています。
フランスのレコルヌ首相は、信任投票が迫る中、政治的な立場にとって重要な予算案について議会に向けて説明しています。政府が崩壊すれば、ユーロは米中貿易のエスカレーションから恩恵を受けることができなくなるでしょう。
ドイツでは、ZEW調査が経済期待と現在の状況において改善が見込まれています。しかし、これは現状のユーロに強い影響を与えるものではないと考えられています。
フランスの政治的不確実性は、ユーロに対する主なリスク要因です。我々は、特に今週の木曜日に信任投票が予想される中で、明確な状況が確認できるまでは反発の可能性は極めて低いと見ています。市場は明らかに神経質であり、トレーダーはユーロの強さについて慎重に見るべきでしょう。
この不安感は債券市場にも見られ、フランスの10年物OATとドイツのBundのスプレッドは85ベーシスポイントに広がり、これは最後の主権債務危機以来の水準です。EUR/USDの一週間のインプライド・ボラティリティも12.5%に跳ね上がり、オプション取引者が投票周辺での大きな変動を織り込んでいることを示しています。短期オプションに対してより高いプレミアムを支払うことを期待する必要があります。
米国と中国の間の貿易摩擦がドルを弱体化させる場合でも、ユーロが反発するとは考えにくいです。フランスの内部政治リスクは投資家が無視できるほど重要であり、実質的にユーロは他の取引の資金調達通貨となっています。我々は、今のところ小さな反発に対して売ることが推奨されるアプローチだと考えています。
このパターンは、2017年のフランス大統領選挙の前にも見られました。その期間は、政治的リスクが数ヶ月にわたりユーロを抑制し、市場が結果に確信を持つまで続きました。今も同様の動態が展開されているようで、持続的な上昇の勢いを妨げています。
トレーディングを始めましょう – ここをクリックしてVT Markets口座を開設
経済の混乱した信号にもかかわらず、安全資産への関心から金は$4,100以上で好調に取引されていました
金(XAU/USD)は$4,100以上で安定し、最近の高値を下回っても好意的なバイアスを維持していました。米国トランプ大統領の中国関税に関する方針転換は市場の楽観を支持し、米ドル(USD)は2日連続で上昇しました。2025年に予想される米連邦準備制度理事会の金利引き下げは、金をさらに支える可能性があります。さらに、米政府の長期的な閉鎖の可能性は経済リスクをもたらし、金にさらなる利益をもたらすかもしれません。
地政学的要因も影響を及ぼしており、米中貿易緊張の再燃やロシア・ウクライナ紛争が金の上昇傾向に影響を与えています。トランプの中国に対する柔らかい言い回しは貿易戦争の懸念を和らげますが、金のポジティブな勢いには影響しません。トレーダーは米連邦準備制度理事会がさらに金利を引き下げる高い確率を見ており、金の魅力を強化しています。米ドルの強さにも関わらず、金の強気見通しは変わりません。
テクニカル指標と市場動向
テクニカル指標は、金の上昇傾向が数週間の上昇トレンドラインによって支持されていることを示しています。$4,055-$4,060の抵抗を最近突破したことは短期的にポジティブな見通しを確認しましたが、過熱したRSIの条件には注意が必要です。いかなる引き戻しも購入の機会を提供するかもしれませんが、$4,060を下回る突破は$4,000までの潜在的な下落を示す可能性があります。米ドルは主要通貨に対して上昇しており、特にオーストラリアドルに対して強いです。 金は過去最高値に近い取引をしているため、相反するシグナルに注意する必要があります。主要なドライバーは連邦準備制度理事会であり、CME FedWatch Toolからのデータでは、10月29日の会合で25ベーシスポイントの金利引き下げの可能性が98%であることが示されています。この安いお金の期待は、非利息の金を持つことを非常に魅力的にし、今後数週間の間に人々を惹きつけるでしょう。 現在、3週目に入っている米政府の閉鎖は、安全資産に対して強いサポートの層を追加しています。先週、議会予算局は、閉鎖が続く間にQ4のGDP成長率を週ごとに0.2%削減しているとの初期見積もりを発表し、経済の不確実性を高めています。この状況は、2018年末の長期閉鎖中に見られたように、金価格の堅固な基盤を提供しています。インフレデータと機関需要
このハト派的なFRBの姿勢は、最近のインフレデータによって裏付けられています。最新の9月CPIレポートでは、ヘッドラインインフレが前年同月比で2.8%に冷却していることが示されています。さらに、2025年第3四半期の世界金協会のデータによると、中央銀行はネットで250トンの金を購入しており、強固な機関需要が5四半期連続で続いています。これらの基本的要因は、現在の高価格が短期的な地政学的な騒音を超えて十分に支持されていることを示唆しています。 デリバティブ市場では、この強気な姿勢がオプションポジショニングに反映されています。$4,200および$4,250のストライク価格を持つ12月金先物に対するコールオプションのオープンインタレストは、過去1週で40%を超えて急増しました。しかし、日々の相対力指数(RSI)が80を上回っているため、非常に過熱した条件にあることに留意する必要があります。このため、我々の戦略は、これらの高値での上昇を追いかけるのではなく、価格の引き戻しを買うことに焦点を当てるべきです。2023年の価格の動きを振り返ると、金が新しい高値に達した後に修正し、上昇トレンドを再開したことが分かります。規律あるアプローチは、$4,060-$4,055の支持ゾーンに向かう引き戻しをロングポジションの潜在的なエントリーポイントと見なすことです。トレーディングを始めましょう – ここをクリックしてVT Markets口座を開設
配当調整通知 – Oct 14 ,2025
お客様各位
下記の商品につきまして、配当金が調整される予定ですのでご案内いたします。インデックス配当は、お客様の取引口座に対して残高明細を通じて個別に実行されます。コメント欄には以下の形式で記載されます:
「Div & 商品名 & 純ボリューム」
詳細は、以下の表をご参照ください。
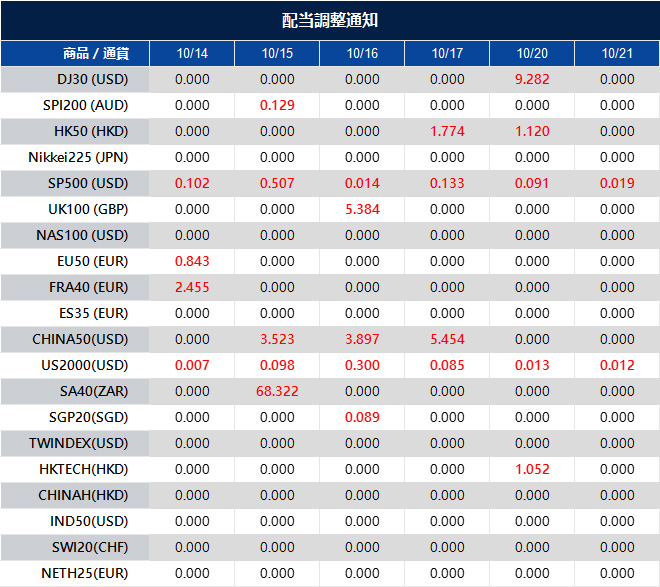
上記のデータは参考用となります。正確な情報につきましては、MT4/MT5ソフトウェアをご参照ください。
詳しい情報が必要な場合は、 [email protected] までお問い合わせください。
貿易の懸念が再燃したため、WTI原油は58ドル近くまで下落し、最近の五ヶ月の安値に迫っていました。
石油価格は、米中貿易戦争の懸念が再燃したことで、火曜日に$1以上下落し、約$58.00となりました。米国と中国は貨物船に対する税金を引き上げ、貿易期待に影響を与え、石油の供給過剰に対する懸念を高めています。
増加する原油生産と貿易不安
ベンチマークのウェスト・テキサス・インターミディエイト(WTI)原油価格は、5か月ぶりの安値である$57.90以上で推移しています。米中間の緊張が緩和されることへの期待がある一方で、両国は強硬姿勢を維持しています。トランプ大統領は10月下旬に習近平国家主席と会談予定です。 一方で、原油生産は11月に追加で137,000バレル/日の増加が見込まれています。この増加は予想よりも小さいものの、貿易不安が続く中で石油の供給過剰の可能性を高めています。 WTI原油は、高品質な原油であり、精製が容易なため、アメリカで産出され、市場のベンチマークとして機能しています。WTI価格に影響を与える要因には、供給と需要の動向、政治的な不安定さ、OPECの決定、米ドルの価値が含まれます。 毎週のAPIおよびEIAレポートは、在庫の変動を浮き彫りにすることでWTI原油価格に影響を与え、供給と需要の変化を示すことがあります。OPECは、供給レベルに影響を与えるため、生産割り当てを調整することで価格に影響を与えることがよくあります。貿易不安が石油価格に与える影響
2025年10月14日、WTI原油は$58の水準で苦戦しています。米中間の新しい貨物船に対する税金が感情に直接的な影響を与え、世界貿易の大幅な減速を懸念させています。この動きは二国間の計画されている10月下旬の会議に深刻な疑念を投げかけています。 この貿易不安は、弱まる世界経済の状況に拍車をかけています。先週の国際通貨基金(IMF)の報告は、4四半期連続で世界成長予測を下方修正し、貿易摩擦を主要な懸念事項として強調しています。また、最近のユーロ圏およびアジアの購買担当者指数(PMI)データにも、期待を一貫して下回っていることが反映されています。 供給面では、市場は午後のAPI在庫レポートに注目しています。先週のEIAデータでは予想外の210万バレルの在庫増加がありました。さらなる増加が確認されれば、供給過剰の懸念が高まります。これは、生産者が来月出力を増加させる計画を立てていることから、特に注意が必要です。 この状況は、2018-2019年の貿易戦争時の市場動向を思い起こさせます。当時、トレーダーは下落リスクを保護するためにプットオプションを購入し、ネガティブなヘッドラインによって引き起こされた類似の価格下落から利益を得ました。現在の環境は、プットを通じて下落リスクの保護を所有することが賢明な戦略であることを示唆しています。 価格が下落する中、今後数週間でボラティリティが高まる可能性があります。この予想される価格変動の上昇を取引するために、ストラドルやストラングルのようなオプション戦略を考慮する必要があります。OPEC+からの声明に注意を払い、緊急会議のうわさが流れれば、価格が$55の水準へと下がる際に底を打つ可能性があります。トレーディングを始めましょう – ここをクリックしてVT Markets口座を開設